

These 5 Charts Suggest You’ve Missed Your Last Chance To Buy Bitcoin Under $30K?
These 5 Charts Suggest You’ve Missed Your Last Chance To Buy Bitcoin Under $30K?
Is This Bitcoin Cycle Different?

Many people are confused why BTC is the best-performing asset of 2023, pumping by over 100% this year alone.
However, what’s happening today in 2023, has happened on 3 prior occasions in 2012, 2015, and 2018.

Bitcoin was only $15,500 in November 2022, but today it’s over $30,000, leaving many macro analysts scratching their head, and pondering what comes next for Bitcoin, as it rallies while the globe stutters towards a global economic depression.
However, what we’re living through right now is something we’ve seen 3 times Before in Bitcoins history!
So, will Bitcoin ever return below $30K ever again?
To answer that question, we need to begin by looking at the prior bear markets and bull market cycles.

We know that around 365 days before each halving, like clockwork.
Now, I don’t know whether Bitcoin has bottomed or not, but what we do know is that when Bitcoin bottoms, the price RUNS AWAY FROM you, VERY fast!
Let me demonstrate.
Taking a closer look at the 2011 bear market, Bitcoin ended the brutal 93% bear market with a bang.

To end the brutal 93% decline, and 2011 bear market, Bitcoin rallied 260% in only 49 days, rallying from $2.02 in Nov 2011, to over $7 by the 5th of Jan!

A key indicator to determine when a bear market is over, is watching for when the asset doubles in price.
Bear market rallies are usually not that successful…

In 2011 BTC only took 32 days to double in price, bottoming at $2.02 in November, and hitting $4.04 cents on the 20th December 2011.

Bitcoin did a similar thing to end the 2015 bear market.
In the 2015 Bear, Bitcoin put in A final capitulation low on the 24th August 2015 at under $200, and in the short span of only 120 days, rallied from under $200 to over $500, for a 150% gain.

This rally once again caught everyone off guard, and in this bear market it only took Bitcoin 70 days to double in price.
Some will notice the ACTUAL low for that cycle in 2015 happened was the 14th in 2015 with BTC wicking down to $170 briefly, but we can see on both dumps, Bitcoin didn’t spend much time below $200.

In 2019 Bitcoin once again surprised the critics, as it broke out of a long-term decline in price action to rally by over 250% in 91 days, from $3.8K to $13K.
When the Bitcoin low was put in on Saturday the 15th of December 2018 at around $3200, we hit $6,400 150 days later on the 15th of May 2019.

Today, in 2023, Bitcoin bottomed at $15.5K on the 22nd of Nov, and we’re now about to hit $31K, around 145 days later….
Which is nearly a double in price.

So, Bitcoin has doubled in price from its’ 2022 low, does that mean it’s officially bottomed?
Nobody knows the answer to that question, but what we do know, is Bitcoin is becoming less volatile in each cycle.
We can see this when we look at the Bitcoin DOUBLE D metric for each cycle:
2011: 32 days
2015: 70 days
2018: 150 days
2023: *145 days*
Double D= ‘’Days to Double’’
So, we know that Bitcoin rallies fast once it bottoms, and price NEVER returns to its lows once the price of Bitcoin doubles.
However, some people aren’t convinced we’ve even have bottomed yet, so let’s dive into some more data!
Well, the Bitcoin halving is coming, and is less than 1 year away!
This means that a new Bitcoin 4-year cycle is beginning…..

To learn more about the halving cycles, make sure you check out this video we did on the topic earlier in the year.
In that video we analyzed the length of prior bear markets, as well as a number of other metrics that suggest whether Bitcoin has bottomed or not.
On a timing-centric analysis looking at prior cycles, we could expect the November low at $15.5K to be a probable time that #Bitcoin would put in a bottom.
2015 - 426 days
2018 - 365 days
2022 - 390* days

Then, on a price-related analysis of prior cycles, we can see that the Bitcoin drawdowns are becoming smaller and smaller each cycle.

But, what if this time is different?
What if the past 14 years of data modeling the price of Bitcoin is irrelevant?
While many people believe the price of Bitcoin will continue to become less and less volatile in the coming years, I don’t see how that is possible.
Bitcoin is a technology, and we know technologies get adopted in exponential waves that follow the shape of an S-curve.
Why would Bitcoin be any different?

In a few of the more recent technological adoptions in the digital age, we can see it generally takes the same amount of time to go from 0-10% adoption, that it does to go from 10-90%.

In our modern environment, each successive technological innovation is being adopted at an ever-increasing rate. I believe Bitcoin is positioned to continue this trend of more and more rapid technological adoptions on its journey to Hyberbitcoinization.
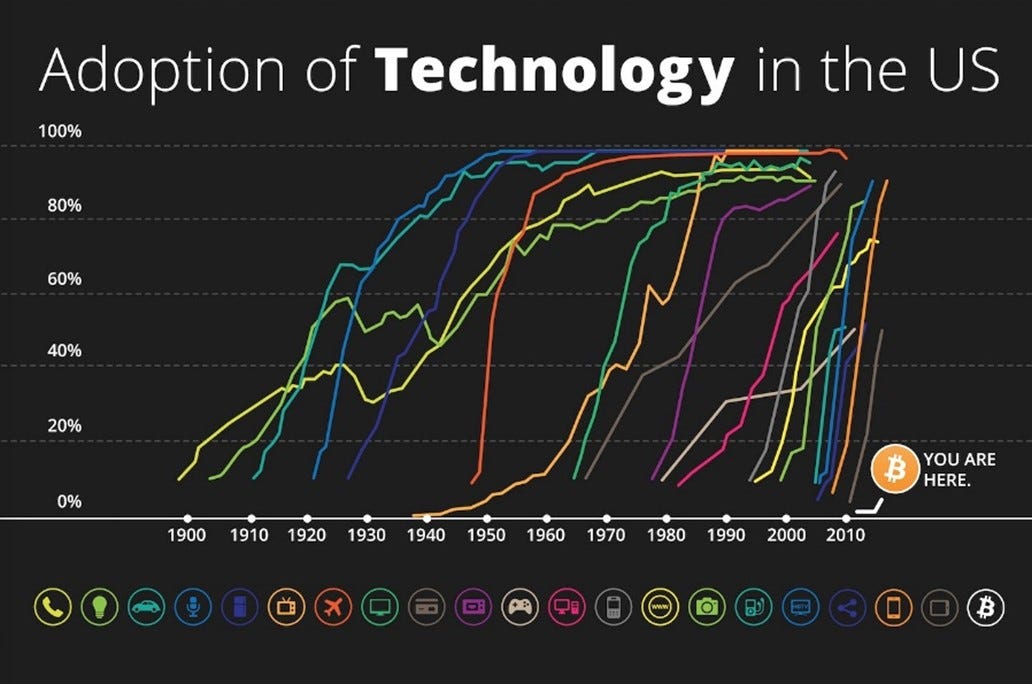
So, is Bitcoin about to begin climbing the steep part of the Technological S-curve?
What if Bitcoin has already entered a new epoch?
Epoch #2 in its adoption curve?

https://twitter.com/LukeMikic21/status/1607133421335093248?s=20
If you made it this far, you’ll love the video I published on this topic today, exploring this topic in more detail.
To read more, consider supporting my work, and I will repay you with some Bullish conclusions.
Keep reading with a 7-day free trial
Subscribe to Luke Mikic - All Signal No BS to keep reading this post and get 7 days of free access to the full post archives.